

PitchIQ Just Got Smarter. Here's What's New!

PitchIQ Is Live. Here’s Why It’s Different.
I want to tell you about something I’ve been quietly building since April — and why I think it’s going to change how you evaluate minor league hitters.
Let me start with the honest version.
Most MiLB data tools give you a box score with extra steps. AVG, OBP, SLG, HR, SB. Maybe wRC+ if you’re lucky. That’s fine for what it is. But it doesn’t tell you why a player is producing, whether they’ll keep producing, or whether the guy with the .220 average is actually the most interesting name on the board.
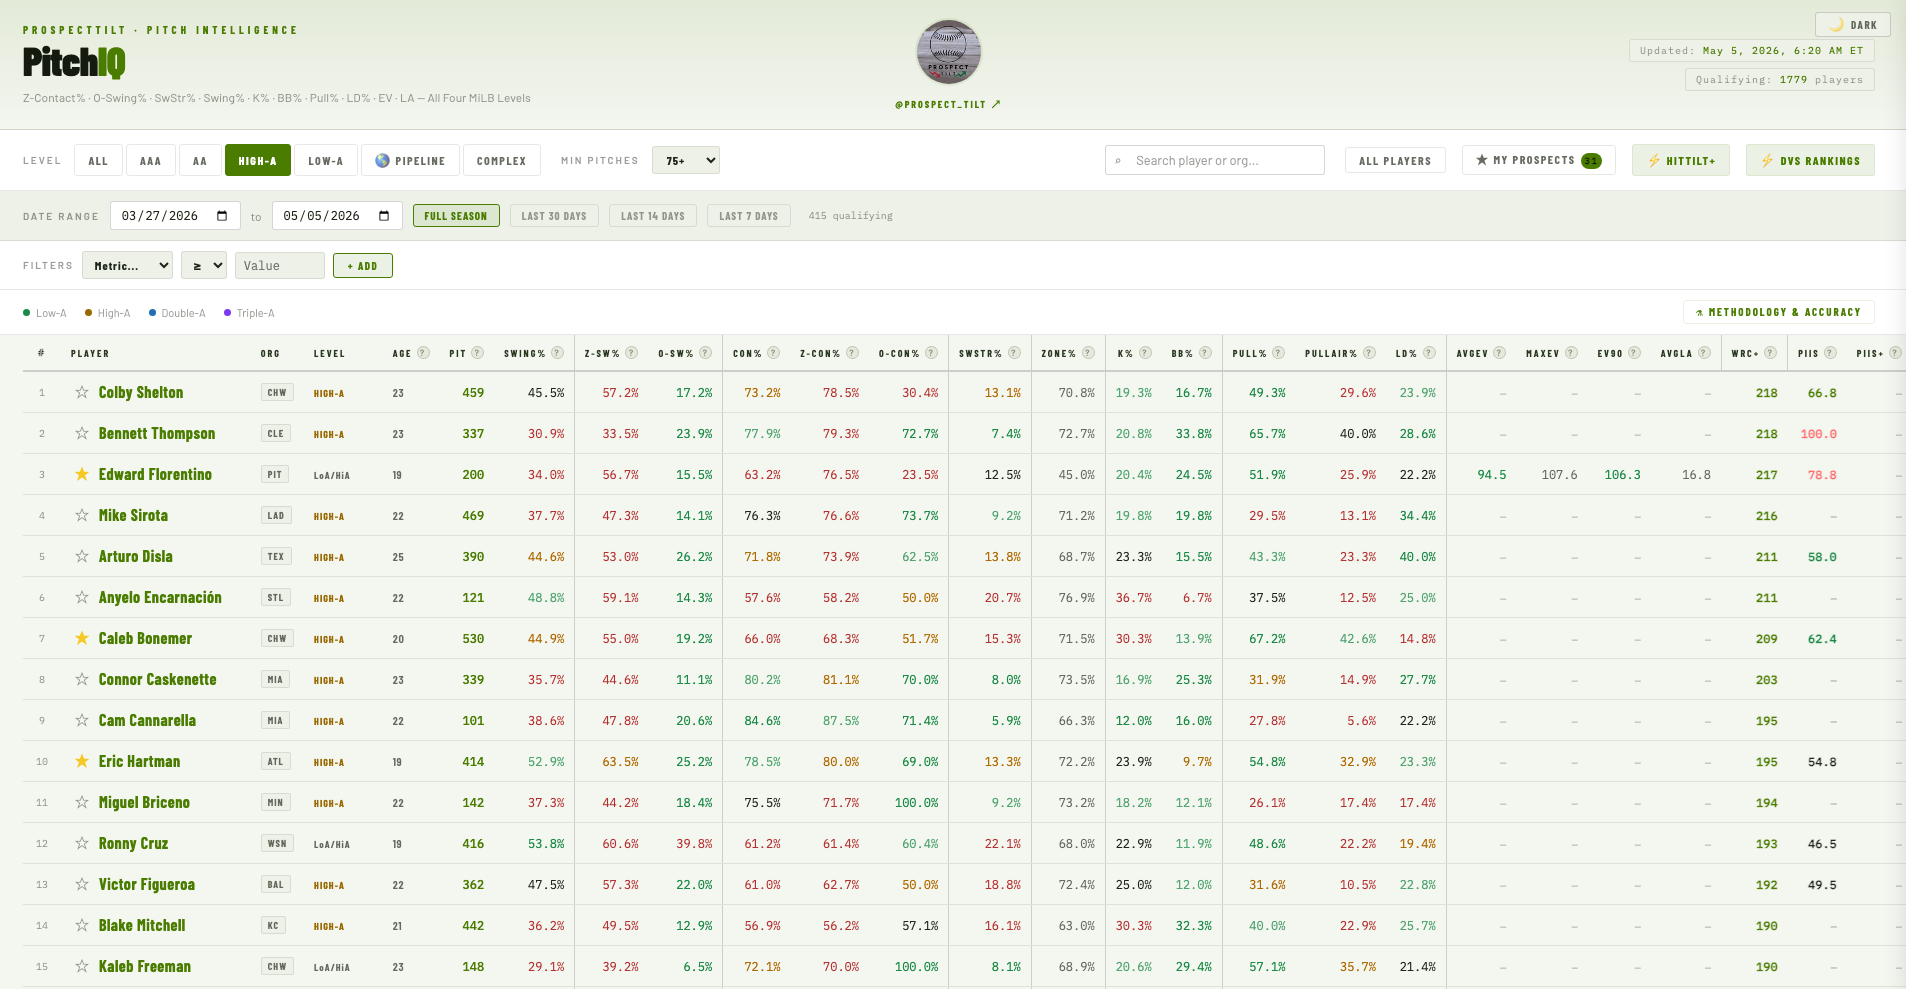
PitchIQ does something different. It pulls live pitch-level data from the MLB Stats API across all four full-season MiLB levels — Triple-A, Double-A, High-A, and Low-A — every 15 minutes during the season. Z-Contact%, O-Swing%, SwStr%, Zone Contact, Pull Air%, Exit Velocity, Launch Angle, EV90. The same stuff MLB front offices use to evaluate their own players. Except now you have it too, on every qualifying hitter at every level, updated every morning.
That’s the foundation. But what I’m most excited about is what we built on top of it.
HitTilt+ is now live on PitchIQ.
You can find it under the HitTilt+ tab at the link below for subscribers. It updates automatically every morning with the previous night’s games baked in — no manual uploads, no weekly refreshes, no lag.
HitTilt+ is a composite hitting metric I’ve been running privately for a while. It combines walk rate, strikeout rate, ISO, wOBA, OPS, swinging strike rate, stolen base rate, exit velocity, launch angle, and an age/level bonus into a single score. A 19-year-old holding his own in Double-A gets rewarded differently than a 24-year-old doing the same thing. That age/level context matters enormously in dynasty and shouldn’t be an afterthought — so we baked it in.
Players 26 and older are excluded. This is a prospect tool, not a leaderboard for AAA veterans padding their stats. The age cutoff keeps the signal honest.
The tab shows you the full picture: Org, Level, Age, PA, AVG, OBP, OPS, ISO, wRC+, BB%, K%, BB/K, SwStr%, HR, SB, EV90 where available, Launch Angle where available, and HitTilt+ as the anchor column sorted descending. Click any player name and the full PitchIQ panel opens — monthly breakdown, comps, radar chart, percentile bars, decision map, the works.
My Prospects is the feature I use most personally.
Star any player on the leaderboard and they get saved to your watchlist. That’s it. No account required. No login. No syncing to a server. It lives in your browser and it’s there every time you come back.
Click My Prospects and the entire leaderboard collapses to just the players you’ve tagged. Every filter still works — date range, pitch threshold, metric filters, all of it. You’re not looking at 2,000 players anymore. You’re looking at your 40. Or your 15. Or the 8 guys you’re targeting in your next trade window.
The reason this is a game changer for dynasty is that MiLB monitoring is a volume problem. There are over 2,000 qualifying hitters in PitchIQ right now across four levels. Nobody has the bandwidth to check on all of them daily. But you have a roster. You have a watch list. You have guys you’re selling high on and guys you’re buying low on and guys you drafted in the first round two years ago and need to check in on before your next trade deadline.
My Prospects turns PitchIQ from a research tool into a monitoring dashboard for your specific portfolio.
Tag a guy when you see something interesting in the leaderboard. Tag your whole roster before a trade deadline. Come back the next morning and your My Prospects tab shows you exactly how each of them performed overnight with fully updated stats. You can run a PIIS-T filter on just your prospects to see who has elite process scores. You can filter by K% ≤ 20 across your watchlist to see who’s keeping the strikeouts down. You can set a date range to the last 7 days and see who’s been hot since your last check-in.
It’s the difference between doing research and actually staying on top of your team.
The star button is on every row in the leaderboard and in the top right corner of every player panel. One click to add. One click to remove. The badge next to the My Prospects button shows your current count. Clear all resets it instantly.
I built it because I kept finding myself opening ten browser tabs to track players I cared about. Now I don’t have to.
The player card is where PitchIQ separates itself from everything else.
Click any name on the leaderboard and a full panel slides out. Not a popup. Not a modal with three stats and a headshot. A full two-column deep dive that takes everything we know about that player and puts it in front of you in one place.
Left side: the stat grid. Full season summary — AVG, OBP, SLG, OPS, ISO, wRC+, HR, SB, O-Swing%, Z-Contact%, SwStr%, K%, BB%, PullAir%, LD%, xwOBAcon, xDamage, xwOBA where available. Month by month breakdown so you can see the trajectory, not just the season line. Date range filters — pull the last 7 days, last 14, last 30, or set a custom window. Everything recalculates instantly. Then comps — MiLB historical comps, MLB outcome comps, and a Hitter Fingerprint chart that plots the player’s profile against their closest MLB match across eight dimensions simultaneously.
Right side: five tabs that each tell a different part of the story.
Profile — a radar chart across six dimensions (Power, Discipline, Contact, Pull, Hard Contact, Speed) with a compare tool where you can search any other player in the system and overlay their profile directly on top. Below the radar, percentile bars for every tracked metric ranked against their level peers. The bar tip is a headshot. The gradient runs green to orange to red. It’s fast, it’s visual, and it tells you in about three seconds whether a player is elite, average, or a concern in each category. PIIS-T and PIIS-T+ now live in the percentile bar stack too.
Decisions — a swing decision map. At Triple-A and Low-A Florida parks where Hawk-Eye is deployed, every pitch the player has seen this season is plotted as a dot on a coordinate grid relative to the strike zone. Green dots are good swings. Blue dots are good takes. Red dots are chases. Orange dots are taken strikes. You can see at a glance whether a hitter is disciplined, whether they have a hole in the zone, whether they’re being attacked in a specific quadrant. Change the date range and watch the map update in real time. At Double-A and High-A the map gives you the aggregate decision stats instead — still useful, just without the coordinate layer.
Comps — the MLB Probability Index first. A 0–100 score across six tiers from Long Shot to Potential MLB Regular, built from level reached, age context, discipline metrics, power, contact quality, and signing pedigree. Below that, the Hitter Fingerprint butterfly chart — the player on the left, their closest MLB comp on the right, eight metrics plotted as mirrored bars so you can see exactly where the profiles converge and diverge. Then the full comp cards — MiLB historical comps from a 32,935-season database going back to 2006, and MLB outcome comps from 9,332 seasons going back to 1995.
Projection — aging curves. Exit velocity and ISO projected forward to age 27 with confidence bands that widen as the projection distance grows. At levels without Statcast, ISO, BB%, and K% projection ribbons instead. Not predictions — directional context for what the aging curve says about this specific profile.
Rankings — every industry ranking that player appears in across five publications: The Athletic, Baseball America, FanGraphs, MLB Pipeline, and RotoWire. All in one place, with the tier color-coded by rank position.
And across the top of the card: position, handedness pill, height and weight, park factor badge telling you whether they play in a hitters park or pitchers park, draft info or IFA signing bonus and class year, and the DVS badge with their Dynasty Value Score and national rank.
It is a lot of information. It is organized so none of it feels like noise.
The metric filter is something I haven’t seen anywhere else at the MiLB level with these specific metrics.
Below the date range controls you’ll find a three-part filter builder. Pick a metric from a dropdown — Z-Contact%, Chase Rate, wRC+, K%, ISO, SwStr%, PIIS-T, HitTilt+, anything in the system. Pick an operator — ≥, ≤, =. Type a value. Hit Add.
It renders as a pill. Stack multiple filters. Remove them one at a time with the ✕ or clear everything at once.
The reason this matters is that MiLB scouting is almost entirely done by feel. “This guy has a good approach.” “That kid hits the ball hard.” With metric filters you can run the actual query. Show me every Low-A hitter with BB% ≥ 12, SwStr% ≤ 8, and wRC+ under 110. That’s your buy-low list. Those are the players the process says are better than the box score shows — and now you can surface them in about ten seconds.
It works across every level tab and even on the Complex League tab. Filter for age ≤ 19 with ISO ≥ .150 in High-A and see who shows up. I think you’ll find some names you haven’t been talking about enough. I’m finding myself using this feature more and more, especially filtering out for contact rates, power aggregate stats, and age.
We also built PIIS-T — Prospect Impact Intelligence Score.
It’s our most analytically rigorous metric and I’m genuinely proud of it. T-Score normalized within level — 50 is always exactly level average, every 10 points is one standard deviation. It combines Z-Contact%, BB%, ISO, and SwStr% into a single process score that works at all four levels using exact data, not coordinate estimates.
The core use case: high PIIS-T with suppressed wRC+ is your diamond in the rough signal. The process is elite but the results haven’t caught up. When you see a Double-A hitter with PIIS-T above 65 and wRC+ under 120-130, that divergence has a reason — bad BABIP luck, pitcher-friendly park, small result sample. History says it corrects upward.
Flip it: high wRC+ with PIIS-T under 35 is your regression candidate. Sell before the industry figures it out.
We’re also tracking Complex League. Live. Every game.
The ACL and FCL — Arizona Complex League and Florida Complex League — are where the youngest professional players in the world take their first at-bats. Most of them just signed. Some are 16 years old. A few are going to be stars and nobody outside of a handful of front office scouts knows their names yet.
PitchIQ tracks all of it.
Hit the Complex tab and you get a dedicated leaderboard separate from the main four levels. K%, BB%, AVG, OBP, SLG, ISO, HR, SB, wRC+ — all live, all updating every morning with the previous night’s games. Filter by minimum PA so you’re not looking at a guy with 3 plate appearances. Sort by any column. Click any name and the full player panel opens.
This is where dynasty advantages are actually built.
By the time a prospect gets to Low-A and starts showing up on prospect lists, the industry has already found them. The $4 million IFA signing who just arrived in the FCL at 17 years old and is posting a 140 wRC+ in his first week of professional ball — that’s the name you want before Baseball America writes the feature. That’s the buy before the price goes up.
The Complex tab also connects directly to the Pre-Pro Pipeline. We’re tracking every significant IFA signing from the 2021 through 2026 classes — bonus amounts, FV grades, country of origin, signing year — and cross-referencing them against live Complex stats in real time. When a $5 million IFA shows up in the FCL for the first time, his signing context is already in the system. You’re not just seeing a stat line. You’re seeing a stat line with full pedigree attached.
Luis Hernandez — the Giants’ $5 million IFA from the 2026 class — hit a home run in his first professional game. He’s already in PitchIQ. His stats are live. His IFA badge is on his player card. The industry will catch up to him eventually. You can be watching him right now.
That’s the whole point. The earlier you’re paying attention, the better your information advantage. Complex League data used to be word of mouth from scouts at the backfields (and still is to some extent). Now it’s on your screen every morning, however.
A few things I’ll share that I haven’t announced anywhere yet.
Several Major League organizations have shown interest in the dashboard and are currently using it as part of their player evaluation process. I’ll leave it at that for now. But it tells you something about the data quality and what it surfaces that traditional reports don’t.
Next up: we’re building pitch data for minor league pitchers. Same infrastructure, same methodology, turned around to evaluate arms across all four levels. SwStr%, velocity, shape — all of it, live, every morning. That’s coming and when it drops I think it’s going to unearth some pitching gems the industry hasn’t found yet. And of course, TiltValue will then be migrated onto the site which will update automatically and live each morning. This will be your all in one, go-to resource if you are part of the ProspectTilt family. And if you’re not yet, I’d consider subscribing and supporting everything we’re doing here.
Check the site. Dig into the HitTilt+ tab. Run some filters. Click on a player you’ve been curious about and spend five minutes in their panel.
I built PitchIQ because I wanted a tool I actually wanted to use. I think you will too.
Below the paywall is the link to the site. I hope you all enjoy and if you have any questions feel free to reach out to me on X/Twitter or on here.
— PT