

HitTilt+ Leaderboard + Hitting Data Visualized 4/29

Every Monday that passes the closer we get to a normalized HitTilt+. I still have the threshold fairly low at 40 plate appearances, but I’ve listed PA next to each player’s name.
I’ll include a plot that I made that visualizes Total Bases/At Bat: SwStr% and I’ll make it interactive so that you can search by age, level, name, and/or team. I’ll include a few examples below.
Here is the plot for Total Bases/At Bat: SwStr% as of 4/29 (Minimum 40 PA/ Age 26 and younger):
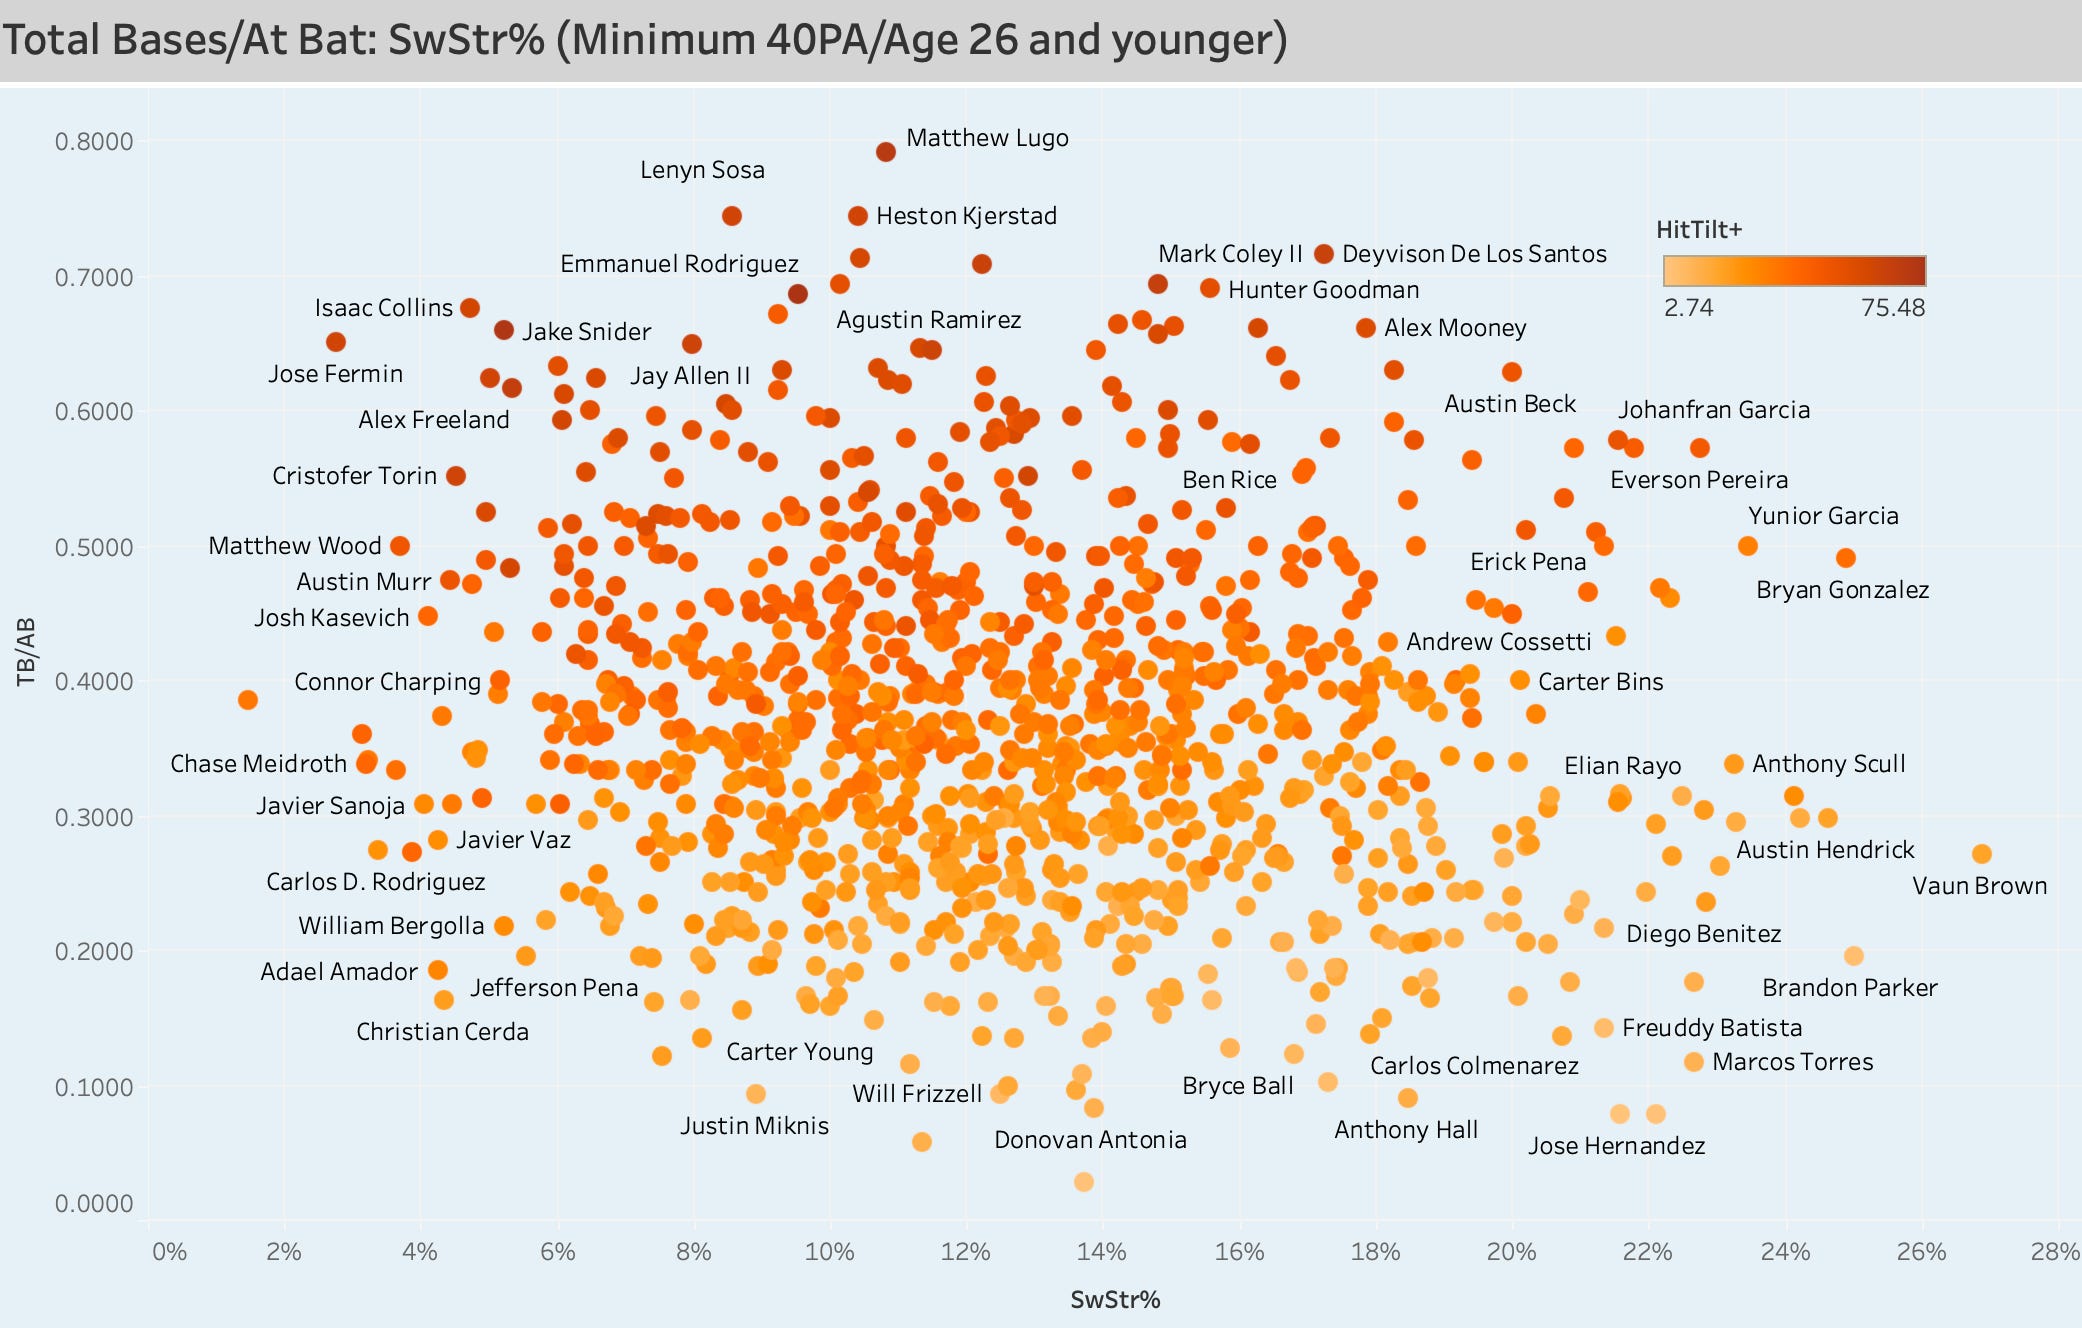
There are over 1000 qualified names now included in the HitTilt+ leaderboard and over 1000 names are displayed on this plot. Only several are listed as it’d get a whole lot of crazy to display each and every name above one another.
So I’ll include a link to this plot as well which will allow you to search by your favorite team or just any team if you’re curious to see where certain players land. This is how you would do it and this is what it would look like:

On the right-hand side will be widgets that include Name, Level, Team, and Age. In this example we’re selecting the Arizona Diamondbacks — so we go to the right-hand side where Teams are listed, click the dropdown button, and select ARI. This plot is the result of clicking ARI and seeing only Diamondbacks players who are qualified. To go back to seeing the full plot you have to click the drop-down on Team and select “ALL”. Selecting “ALL” on any of the widgets will bring you back to the original plot but that doesn’t mean you can stop tinkering.
Let’s say you want to see how all the 19-year-olds are doing — you simply go to the age widget and right-click or slide the button until “19” is listed. To go back you slide it back to the left when “ALL” is listed. Here is the example displayed if you were to search for 19 year old’s on this plot:

You can use multiple widgets at one time as well — so if you’d like to see 21-year-olds at a specific level you just choose the level and age and it’ll display it. The same goes for Team. The easiest one is Highlight Name where you just search for whichever player you want and you’ll see them displayed as long as they’re qualified.
I’ll first include a link to this plot if you want to play around with it and after I’ll include a link to the entire HitTilt+ Leaderboard as of 4/29. Things have yet to normalize and you still have to be actionable, but I included several metrics next to the HitTilt+ value to help you gauge how a certain player is looking in the early going, regardless of the score.